
My company is currently changing it’s fiscal calendar. Due to this we have already received the requirement to adjust all of our reporting solutions. It wouldn’t be a huge problem at all, right? Just changing the calendar and map the days to different periods moving forward. The challenge has come when the requirement involved the ability to have the former period mapping selected switching back to the old calendar. And of course we are talking about an enterprise level solution with 50+ active reports and a dozen of data models, and the solution should be easily adjustable not only by the Data Team, but also thinking about Business Analyst who have their own self-service reports. This point it became interesting :).
First of all I was thinking about the possible solutions, I had three serious ones in mind:
- Two Calendar tables in the model
- Two mapping hierarchy in the calendar table
- Two appended list of dates with different hierarchy mapping
Let’s see their pros and cons:
Two Calendar tables in the model:
Pros: It is pretty easy to separate the old and the new calendar with the name of the table. I would have a New Calendar table with the new hierarchy and an Old table with the old one. Mappings are pretty straightforward in the two different tables
Cons: Hard to consolidate to reports. If I have the dates in two different tables, probably I should create all date related visuals twice with both tables and those could be changed with bookmarks. And bookmark management is pretty heavy workload for that amount of report and not so easy to maintain
Two mapping hierarchy in the calendar table
Pros: I would have a single Calendar table that is pretty straightforward. Two mapping of the dates would also be clear.
Cons: Same as for the above. Even I have the mappings in the same table, I cannot easily change them. It would good to use the Field Parameter option to change between the hierarchies, but that can only connect the fields one-by-one. hierarchies cannot be set to field parameter as a whole so far.
Two appended list of dates with different hierarchy mapping
Pros: I can use the same fields of hierarchy for both the new and old calendar values, and the only thing I need to choose is a dimension that says the date row is for the New or the Old Calendar. It is definitely a huge advantage as I can use the same fields for all visuals and switching between the calendars is only setting one filter.
Cons: This method is duplicating the date values in the Calendar table so I cannot use it directly as a Dimension table, I need to have an intermediary Dates table as dimension connected to the fact tables and the new Calendar table.
For the decision my I considered how much workload would be the model adjustment and the further workload to adjust the reports and how complex it would be then to maintain the new structure. Finally I decided to use the third option, to have two appended list of dates with different hierarchy mappings. This option has a bit of a complexity in the modelling but is very easy to be handled in the reports, a bit more work in modelling against the long term easy use in report creation validated my choice.
Step 1: Creating the Calendar table
In the first step I should have created the Calendar table. First I created both the Old and the New Calendars and as a last step I’ve appended them. I’ve added a field called ‘Calendar’ that shows is the row is related to which one. It looks something like this – note that for the old fiscal calendar the fiscal year started on the 1st of April and the fiscal months started on the last Saturday before the month start:

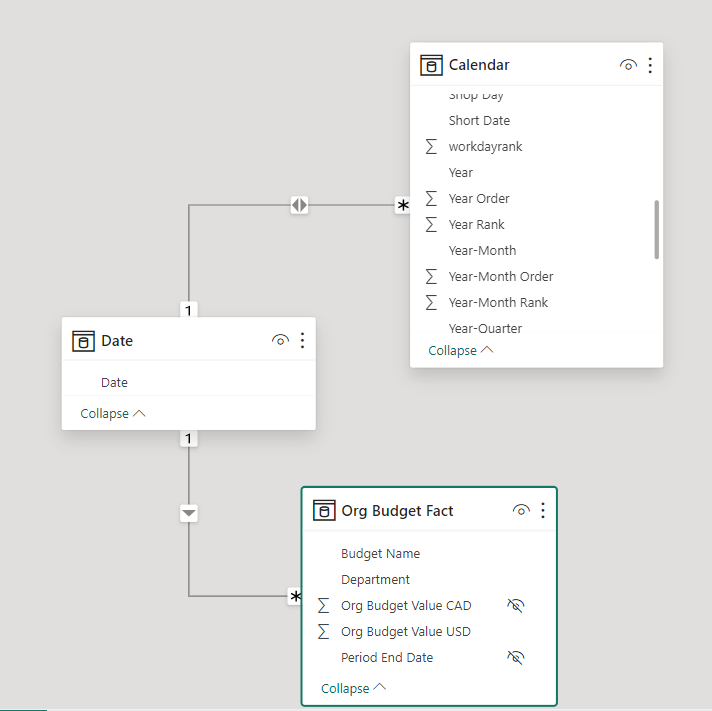
Step 2: Adjusting the data models. As a first step I’ve modified the former Calendar table by keeping only one attribute that’s the Date field. I’ve removed all other columns from that table. Then I’ve added the new calendar table as a new object. This was I could keep all active relationships with the fact tables to the Date field of the former calendar and the only new relationship I had to create was the relationship between the Dates table (former Calendar) and the Calendar table (the new). The only trick in this relationship is the direction of the relationship that should be Both instead of Single as we want to filter the Dates table by the Calendar to filter the facts ultimately. So the model would look something like this:
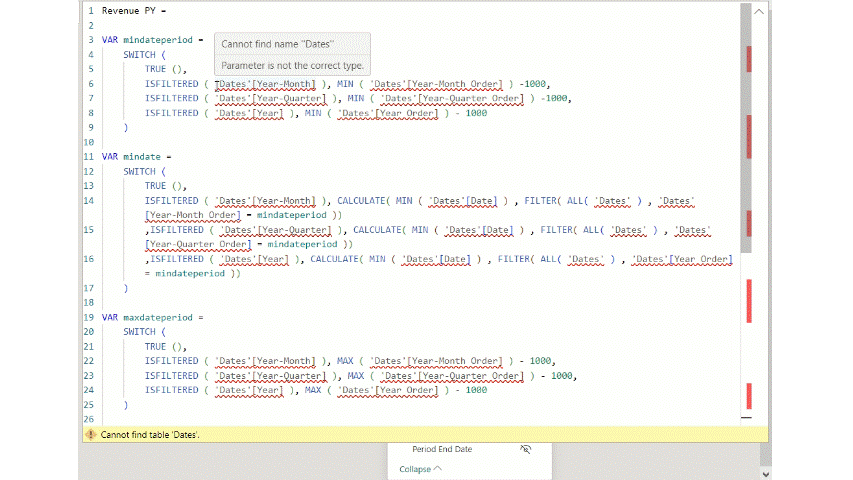
Another task in the modelling is to adjust the measures referencing the former Calendar table that is now Dates table. As this table doesn’t involve former attributes, several measures might be down:
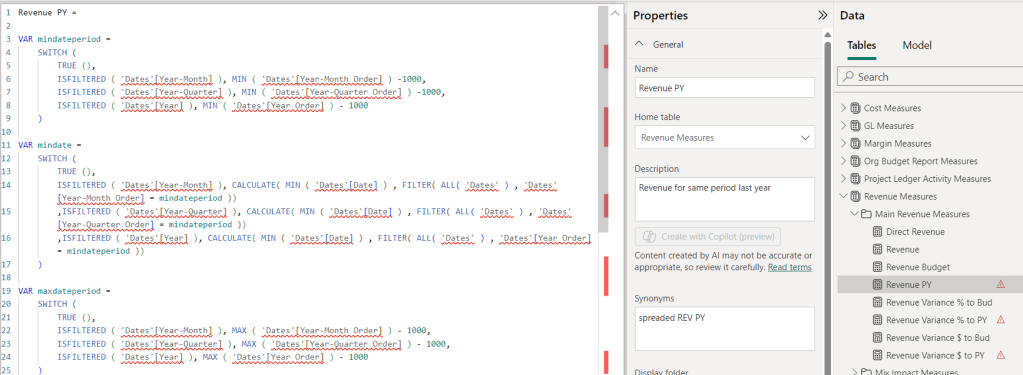
Modifying them to the new Calendar is pretty easy with a key combination trick. I select the ‘Dates’ in the code and I use CTRL + SHIFT + L that is selecting all similar texts in the formula and I can edit them parallelly. I just rewrite it to ‘Calendar’ and the formula is now working properly.
Step 3: Adjusting the reports
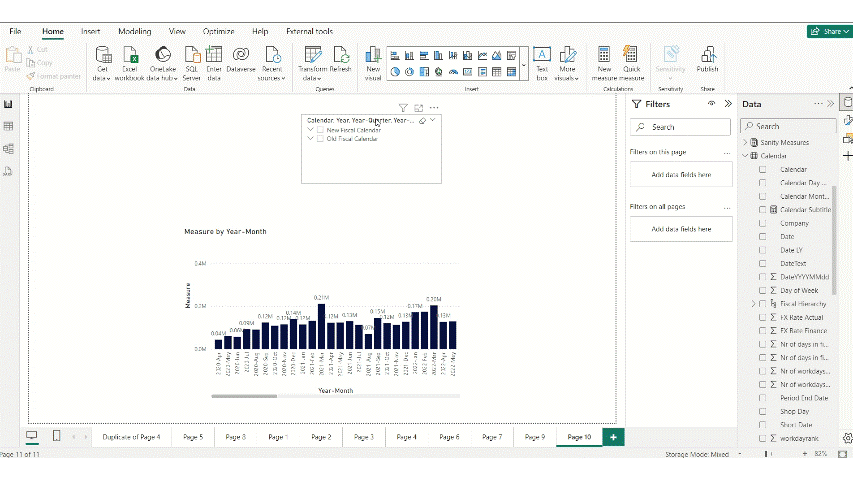
The last step of the new structure is to modify the report part. Here there is an important thing that should be applied, to have one or the other calendar selected. Also it should be emphasize not to select periods from multiple calendars, but only from one of them.
In the canvas I create a slicer and in this slicer I can have one of the other Calendar selected and below that selection there is the calendar hierarchy. With that users can easily choose between the calendars and select the necessary period. For the visuals it is enough to add the calendar hierarchy – or fiscal hierarchy – and it will show the convenient hierarchy based on the slicer selection.

A nice finalization of the slicer might be some guidance either in the subtitle or in the help icon. I’ll now use the subtitle. Also it worth to create a measure that will notify the users in case of invalid period selection. The most elegant way to place it would be to add this measure into the subtitle as dynamic content but as the slicer visual doesn’t filter itself by design, only target visuals, it will not work properly. another option is to create a separate card visual with the text, place it under the slicer visual and group it with that.
Calendar Subtitle =
IF(
DISTINCTCOUNT(‘Calendar'[Calendar])>1
,”⚠️ Please select period only from one Calendar!”
,””
)
That’s it. The report is now ready for use. Going forward the next requirement that we can consider is when business would like to compare new period to an old period that scenario definitely makes sense. For that I’ll share another article soon that explain how I use Time Intelligence in my models.
Cheers!


Leave a comment