powerbi
This category contains content around Power BI
-
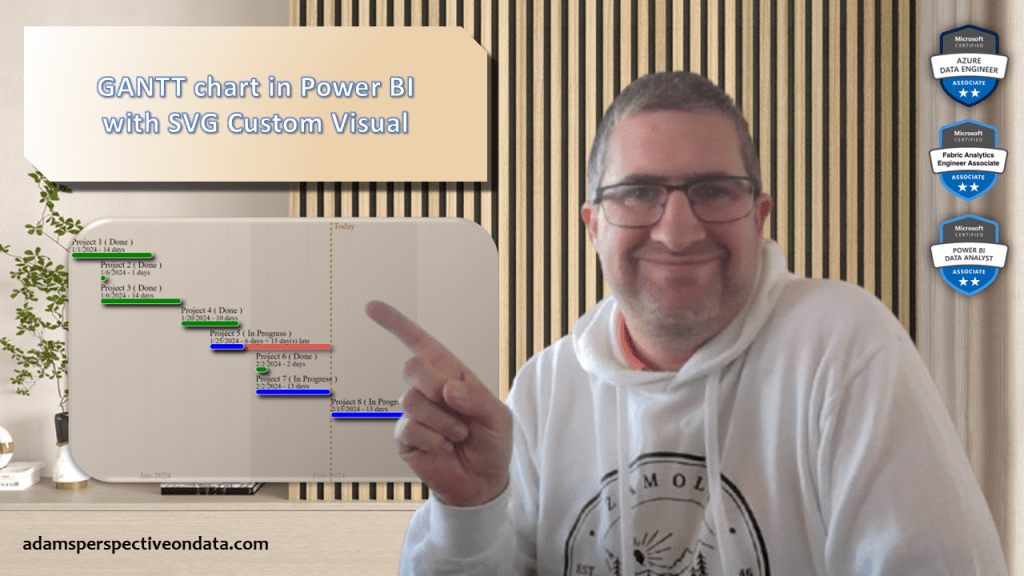
GANTT Chart with Custom SVG Image
In the last couple of days I spent some time learning a bit more about SVG images and their usage in Power BI. There are actually a lot of fun in that stuff, and a lot a things can be solved to create a visual as you want. First I was having some tiny tests…
-
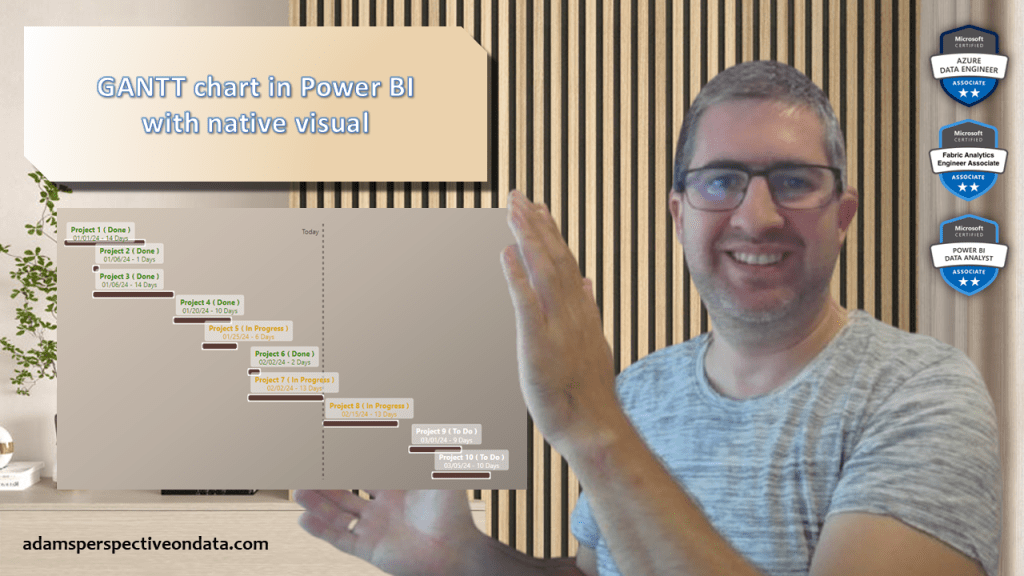
GANTT chart using native visual in Power BI
Let me share you a method in Power BI with that a Gantt chart of projects can be created without using custom visuals. I’m using a single Clustered Bar Chart and setting it’s formatting capabilities.
-
Maven Rail Challenge
In the past few days I spent some time again to participate Maven Analytics’ new challenge, the Rail Challenge. Couple of months since I’ve participated last time, and now it was great to work on some off-work topic again. Here is my entry and below I’m going to explain few of the stuff I’ve made.…

-
Basket and Repeat Purchase Analysis
Optimizing portfolio is a key activity for literally all companies to make sure the offering is ideal for the market. Selecting the right products however is not an easy task and beyond some market survey and analysis, data analytics can definitely help product management teams. I’d like to introduce you two analysis I’ve just recently…

-
Changing Fiscal Calendar with keeping the old one for on demand use
My company is currently changing it’s fiscal calendar. Due to this we have already received the requirement to adjust all of our reporting solutions. It wouldn’t be a huge problem at all, right? Just changing the calendar and map the days to different periods moving forward. The challenge has come when the requirement involved the…

-
“Project Executives” in Power BI? Please, no!
Few years ago I experienced a methodology of implementing Power BI for the enterprise which I just couldn’t understand, why. Let’s call it “Project Executives”. It was a stream which’s purpose was to deliver Power BI reporting solution only for executives, and there were another stream – call it “Project Operations” – which was dedicated…

-
Some Fun by practicing new formatting features and some custom visuals
This week I was practicing a bit in Power BI checking some new formatting functions and customer visuals. The topic was about Lego withing Maven Analytics Lego Challenge. I didn’t want to create an official one pager entry for the challenge, rather trying to put together a motion dashboard with some great features. Here are…
-
Corrupted Measures on Measure Drill-through page
I’ve just faced an interesting issue in Power BI when I tried to setup a new measure on a page which is a drill-through page by measure. Scenario: I have a measure, call it Nr of Deliveries. This measure is based on a Order Table, which have Order Date and Delivery Date assigned to the…
-
Dynamic Column Level Security
I had a project in 2023 in my work where I should secure one column in the data or let’s say a level of data but in a dynamic way. Imaging that as a normal business users you can see Costs and Revenue for the different product categories and their Margin. It is public for…
